 by
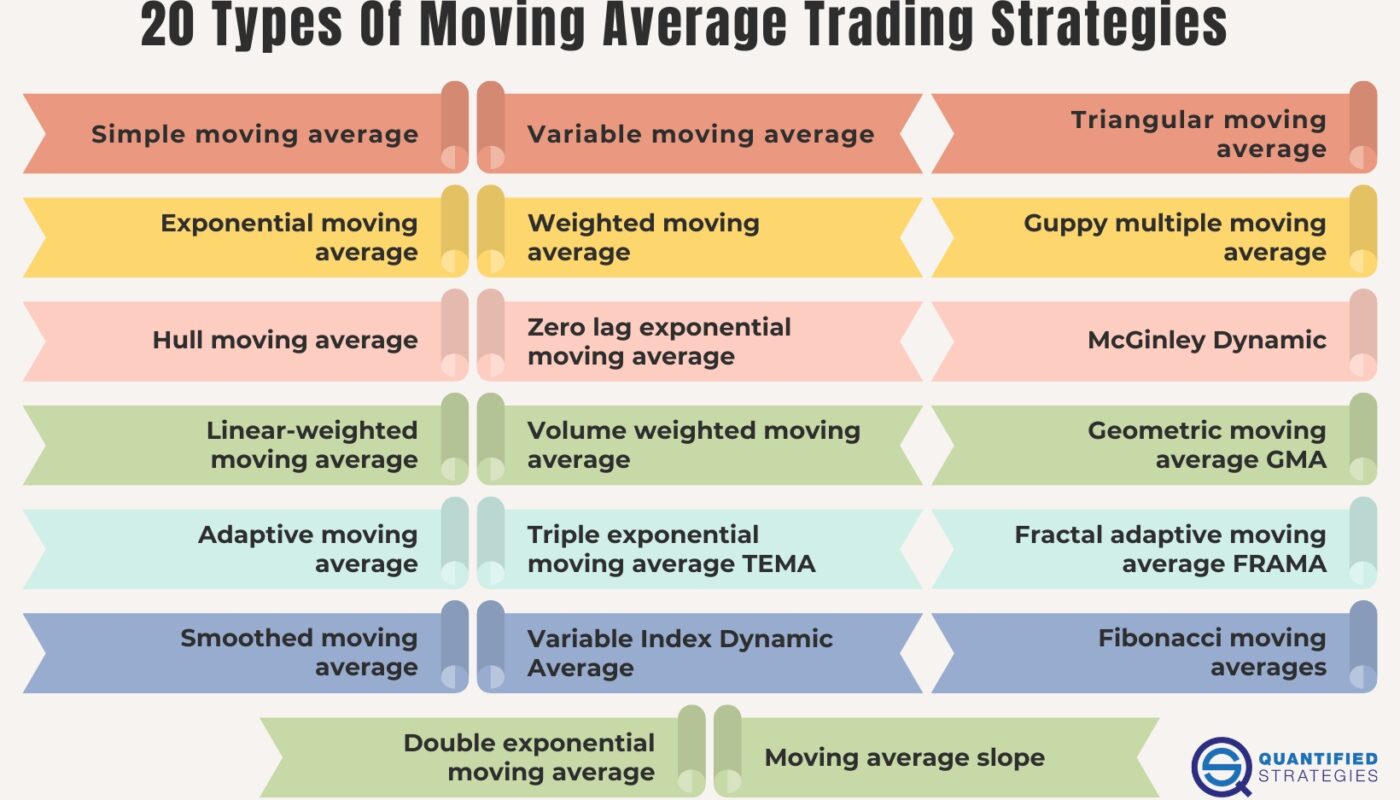
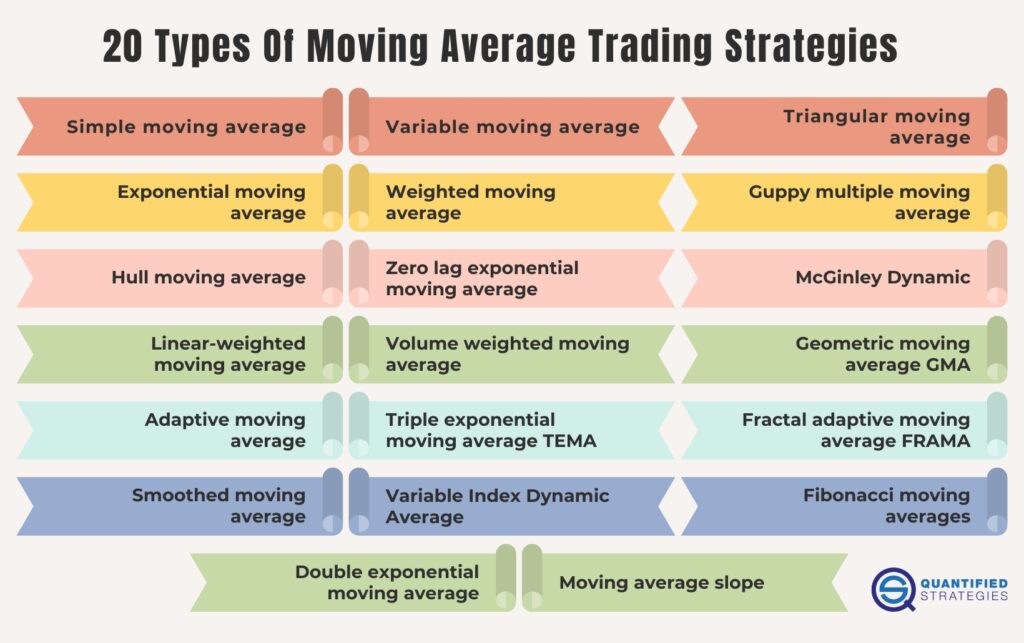
by Discover 20 types of moving average trading strategies, including Simple Moving Average (SMA), Exponential Moving Average (EMA), Fibonacci Moving Averages, and more. Learn how these tools can enhance your trading skills.
Introduction
If you’re serious about trading, you’ve probably heard about moving averages. They’re one of the most widely used technical indicators in the market. Whether you’re trading stocks, forex, or commodities, moving averages can provide you with a clearer picture of price trends, helping you make more informed decisions.
But here’s the catch: not all moving averages are the same. There are different types, each with its own strengths and weaknesses. In this article, we’ll dive deep into 20 types of moving average trading strategies that you can use to fine-tune your trading game.
From the basics of the Simple Moving Average (SMA) to more complex techniques like the Fractal Adaptive Moving Average (FRAMA), we’ll break down each one, explain how they work, and show you how to use them in your trades. So, let’s get started and explore these 20 different strategies!
1. Simple Moving Average (SMA)
Let’s kick things off with the most basic and straightforward moving average – the Simple Moving Average (SMA). The SMA is calculated by taking the average of a set number of prices (typically closing prices) over a specified period.
How it works:
- The formula is simple: Add up the closing prices for a set number of days and divide by the number of days.
- Example: A 10-day SMA would add up the closing prices of the last 10 days and divide it by 10.
Pros:
- Easy to understand and use.
- Helps identify trends over time.
- Works well in a range-bound market.
Cons:
- Lags behind the current price action due to its reliance on past prices.
2. Variable Moving Averages (VMA)
Unlike the SMA, the Variable Moving Average (VMA) adjusts its smoothing factor based on market volatility. This means it’s more responsive to sudden price changes compared to traditional moving averages.
How it works:
- The VMA uses a variable smoothing constant that adapts to the market conditions, so it reacts faster during periods of high volatility and slower during calm periods.
Pros:
- Offers better responsiveness to rapid market changes.
- Helps reduce lag compared to the SMA.
Cons:
- Can be more complex to calculate and use effectively.
3. Triangular Moving Average (TMA)
The Triangular Moving Average (TMA) is another variation of the SMA. It’s calculated by averaging an SMA and applying it to the data again. This creates a smoother curve that reduces market noise.
How it works:
- First, you calculate a simple moving average over a set period.
- Then, you apply another simple moving average to the first moving average.
Pros:
- Smoother than the basic SMA.
- Can help filter out market noise for more reliable signals.
Cons:
- Can still be laggy, especially in fast-moving markets.
4. Exponential Moving Average (EMA)
The Exponential Moving Average (EMA) is one of the most popular moving averages used by traders. It gives more weight to recent prices, making it more sensitive to price changes than the SMA.
How it works:
- Unlike the SMA, which gives equal weight to all prices, the EMA assigns exponentially greater weight to the most recent data points, making it more reactive.
Pros:
- More responsive to recent price movements.
- Reduces lag compared to SMA.
Cons:
- Can be too sensitive, leading to false signals in volatile markets.
5. Weighted Moving Average (WMA)
The Weighted Moving Average (WMA) is similar to the EMA but with a different approach to assigning weights. In this case, the most recent price gets the highest weight, but the weightings are linear rather than exponential.
How it works:
- The most recent price gets the highest weight, and the weights decrease linearly as you move backward in time.
Pros:
- More flexible than SMA and EMA.
- Can be adjusted to respond more to recent price changes.
Cons:
- Still has some lag and can be slow in fast-moving markets.
6. Guppy Multiple Moving Average (GMMA)
The Guppy Multiple Moving Average (GMMA) uses two sets of moving averages to analyze both short-term and long-term trends. It’s named after the Australian trader Daryl Guppy who developed this strategy.
How it works:
- The GMMA includes two groups of moving averages: a short-term group (usually 3 to 6 periods) and a long-term group (usually 12 to 30 periods).
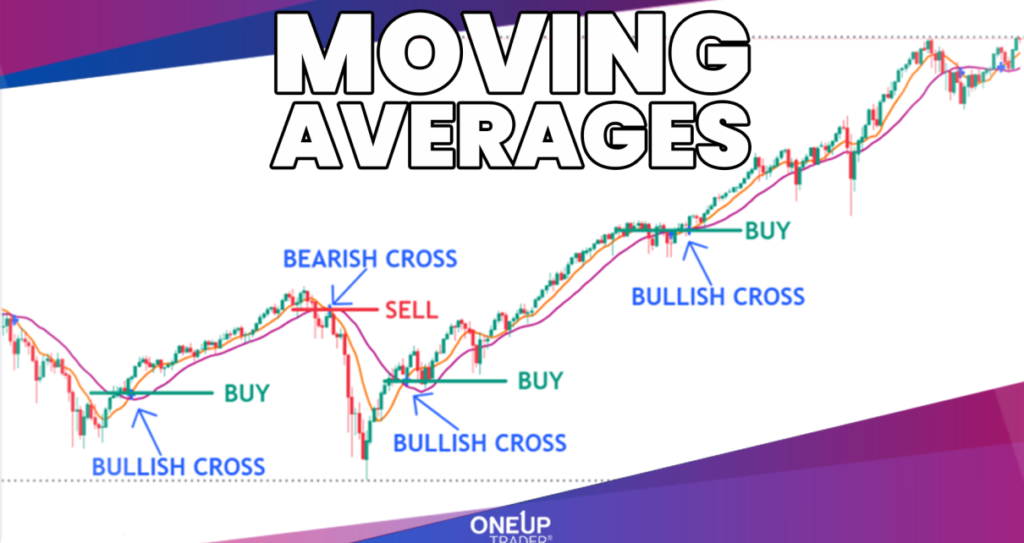
- When the short-term averages cross above the long-term averages, it’s considered a bullish signal, and vice versa.
Pros:
- Helps identify both short-term and long-term trends.
- Great for detecting potential trend reversals.
Cons:
- Can be complex to interpret, especially for beginners.
7. Hull Moving Average (HMA)
The Hull Moving Average (HMA) is designed to minimize lag while maintaining smoothness. It’s calculated by using weighted moving averages and square roots, offering a faster reaction to price movements.
How it works:
- It combines the weighted moving average (WMA) and the square root of a period to smooth out the curve while reducing lag.
Pros:
- Less lag than traditional moving averages.
- Provides a smoother curve with fewer false signals.
Cons:
- Can be difficult to calculate manually without specific software.
8. Zero Lag Exponential Moving Average (ZLEMA)
As the name suggests, the Zero Lag Exponential Moving Average (ZLEMA) aims to remove the lag associated with standard EMAs. It’s designed to be more responsive to price movements without being overly sensitive.
How it works:
- The ZLEMA adjusts the standard EMA formula to account for price trends, reducing the lag while maintaining responsiveness.
Pros:
- Faster and more accurate than regular EMAs.
- Useful for identifying trend reversals quicker.
Cons:
- Might lead to false signals if market conditions change abruptly.
9. McGinley Dynamic
The McGinley Dynamic is a relatively new moving average that adapts automatically to changing market conditions. It’s less sensitive to price fluctuations, making it useful for filtering out market noise.
How it works:
- The McGinley Dynamic adjusts its speed based on market volatility, making it more adaptive than traditional moving averages.
Pros:
- Highly responsive to market changes.
- Less prone to false signals compared to other moving averages.
Cons:
- Requires some experience to use effectively.
10. Linear Weighted Moving Average (LWMA)
The Linear Weighted Moving Average (LWMA) assigns a linear weight to each data point, with the most recent prices receiving the highest weight.
How it works:
- Each price point is multiplied by a specific weight, which increases linearly as you move forward in time.
Pros:
- More responsive than the SMA and EMA.
- Better at capturing recent price trends.
Cons:
- Still has some lag compared to more advanced methods.
11. Volume Weighted Moving Average (VWMA)
The Volume Weighted Moving Average (VWMA) takes both price and volume into account when calculating the moving average. It’s especially useful for identifying the strength of a trend.
How it works:
- The VWMA weighs price movements based on the volume traded, making it more sensitive to large price movements backed by high volume.
Pros:
- Great for confirming trends with volume.
- Useful in high-volume markets.
Cons:
- Can be difficult to use in low-volume markets.
12. Geometric Moving Average (GMA)
The Geometric Moving Average (GMA) uses geometric mean instead of arithmetic mean. It’s less sensitive to extreme values and outliers, making it smoother than other moving averages.
How it works:
- It calculates the moving average using the geometric mean of price points over time.
Pros:
- Smooths out extreme price changes.
- Good for analyzing long-term trends.
Cons:
- May not be as responsive to short-term price movements.
13. Adaptive Moving Average (AMA)
The Adaptive Moving Average (AMA) adjusts its smoothing factor based on volatility and market conditions. It reacts faster when the market is more volatile and slower when the market is stable.
How it works:
- The AMA uses a combination of volatility and efficiency factors to determine its sensitivity to price changes.
Pros:
- Highly adaptive to changing market conditions.
- Can reduce lag and false signals.
Cons:
- Complex to calculate and use for beginners.
14. Triple Exponential Moving Average (TEMA)
The Triple Exponential Moving Average (TEMA) is an advanced moving average that aims to reduce lag even further by applying exponential smoothing three times.
How it works:
- It’s calculated by taking three different EMAs and combining them to create a smoother curve.
Pros:
- Very responsive to price changes.
- Reduces lag significantly.
Cons:
- Complex and may not be suitable for beginners.
15. Fractal Adaptive Moving Average (FRAMA)
The Fractal Adaptive Moving Average (FRAMA) adapts to market fractals (patterns) and changes its sensitivity based on the complexity of the market structure.
How it works:
- It uses fractal geometry to adjust its smoothing factor, making it more adaptive to market changes.
Pros:
- Highly adaptive to market conditions.
- Good for identifying trend changes and reversals.
Cons:
- Requires advanced knowledge of fractals and market patterns.
16. Smoothed Moving Average (SMA)
The Smoothed Moving Average is designed to reduce noise and provide a clearer trend by applying more weight to older data points.
How it works:
- Similar to a simple moving average but with additional smoothing factors applied.
Pros:
- Helps eliminate market noise.
- Provides a clearer trend.
Cons:
- Can be slow to react in volatile markets.
17. Variable Index Dynamic Average (VIDYA)
The Variable Index Dynamic Average (VIDYA) is an advanced moving average that adjusts based on the market’s volatility index. It’s highly responsive to sudden price movements.
How it works:
- The VIDYA uses an index of market volatility to adjust the smoothing constant, making it highly dynamic.
Pros:
- Very responsive to volatility.
- Useful in fast-moving markets.
Cons:
- Can be too sensitive during stable market conditions.
18. Fibonacci Moving Averages
The Fibonacci Moving Averages are based on the Fibonacci sequence, using key Fibonacci levels to set the periods for the moving averages. These levels are said to have a natural connection with market cycles.
How it works:
- The moving averages are calculated using Fibonacci numbers such as 5, 13, and 21 as the periods.
Pros:
- Based on the Fibonacci sequence, which is widely regarded in technical analysis.
- Can offer strong levels of support and resistance.
Cons:
- May not always work in all market conditions.
19. Double Exponential Moving Average (DEMA)
The Double Exponential Moving Average (DEMA) is designed to reduce the lag found in traditional EMAs by using two exponential moving averages.
How it works:
- It uses a combination of two EMAs to create a smoother, faster-moving average.
Pros:
- Faster response time compared to the EMA.
- Helps reduce lag significantly.
Cons:
- Can be too sensitive to short-term market fluctuations.
20. Moving Average Slope
The Moving Average Slope is a strategy that uses the slope of the moving average to determine the strength and direction of a trend.
How it works:
- The slope of the moving average is used to assess the trend. A steep slope indicates a strong trend, while a flat slope suggests a weak or range-bound market.
Pros:
- Simple to calculate and use.
- Can be a good confirmation tool for trend-following strategies.
Cons:
- Doesn’t work well in choppy, sideways markets.
Conclusion
As you can see, there are plenty of 20 types of moving average trading strategies to choose from, each with its own strengths and weaknesses. Whether you’re looking for a simple, tried-and-tested indicator like the Simple Moving Average (SMA), or something more complex like the Fractal Adaptive Moving Average (FRAMA), understanding how these tools work can significantly improve your trading decisions.
It’s important to experiment with different moving averages to find what works best for your trading style and market conditions. Keep in mind, no moving average strategy is foolproof, but with the right approach, they can give you a solid edge in the market.
Happy trading!
