 by
by In the fast-paced world of trading, having a reliable system to analyze price movements and identify trends is crucial. Moving averages (MAs) are among the most widely used technical analysis tools. These indicators help traders smooth out price data to identify trends, determine entry and exit points, and optimize market timing. In this guide, we will dive deep into various types of moving averages, their strategic applications, and how they can be effectively used in diverse market conditions to boost trading performance.
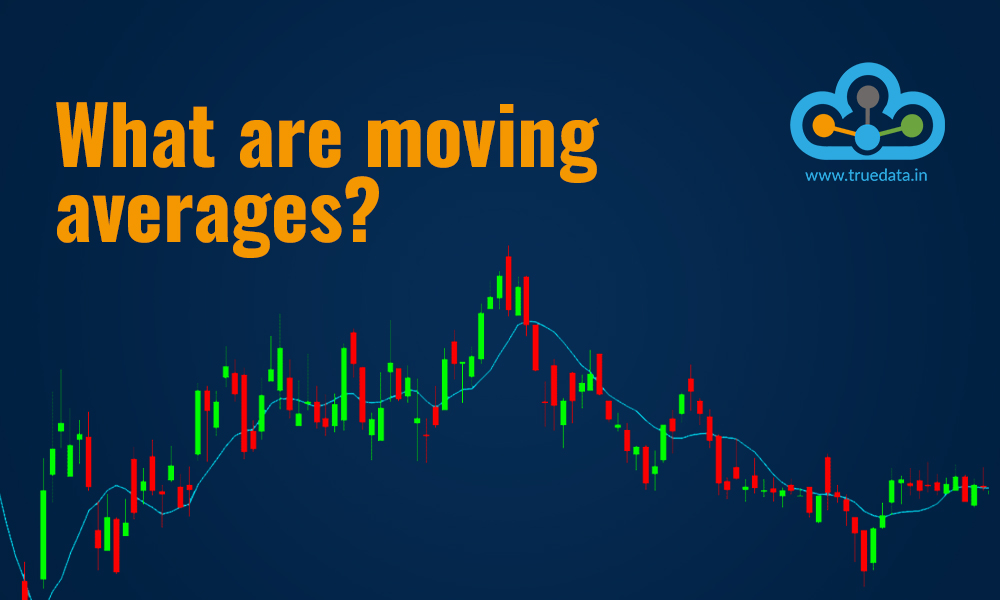
What Are Moving Averages and How Do They Work?
A moving average is a statistical calculation used in technical analysis to smooth out price fluctuations by calculating the average price of an asset over a specified time period. It is often used to filter out the “noise” in price charts, helping traders better visualize market trends.
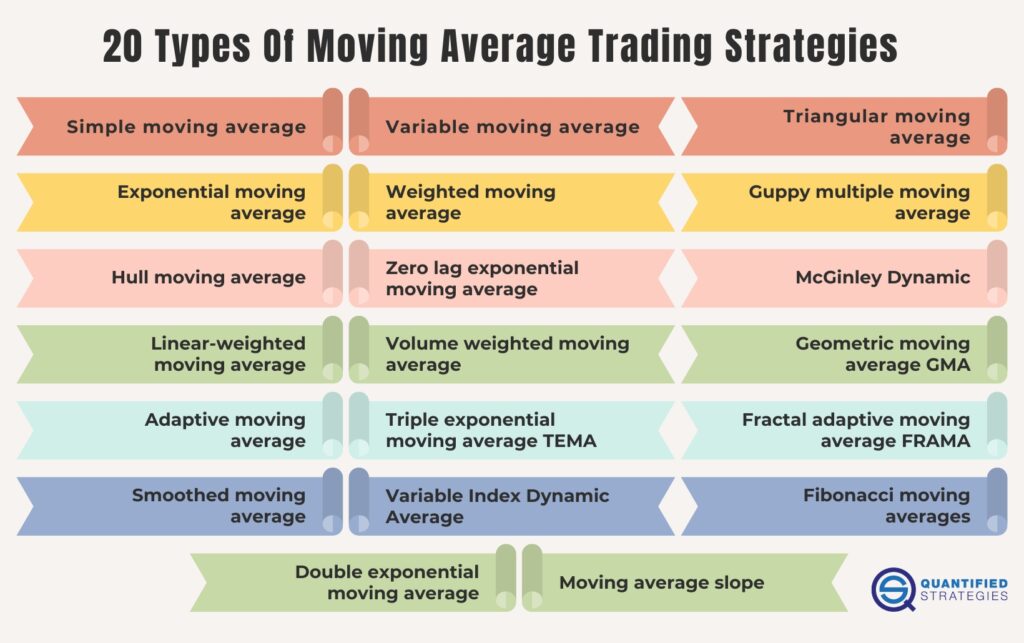
Types of Moving Averages
- Simple Moving Average (SMA): The SMA calculates the arithmetic mean of the prices over a specific period. It is the most basic form of moving average and is widely used for its simplicity.
- Exponential Moving Average (EMA): The EMA gives more weight to recent prices, making it more sensitive to recent price changes. This makes the EMA a preferred choice for traders who want quicker signals.
- Weighted Moving Average (WMA): Similar to the EMA, the WMA assigns different weights to each price point, with more recent prices receiving higher weight. This helps reduce the lag present in other MAs.
- Hull Moving Average (HMA): Developed to reduce lag while maintaining smoothness, the HMA is ideal for short-term trading.
- Adaptive Moving Average (AMA): This moving average adjusts itself based on market volatility. It closely tracks price action when the market is quiet and loosens when volatility increases.

How Moving Averages Are Used in Trading
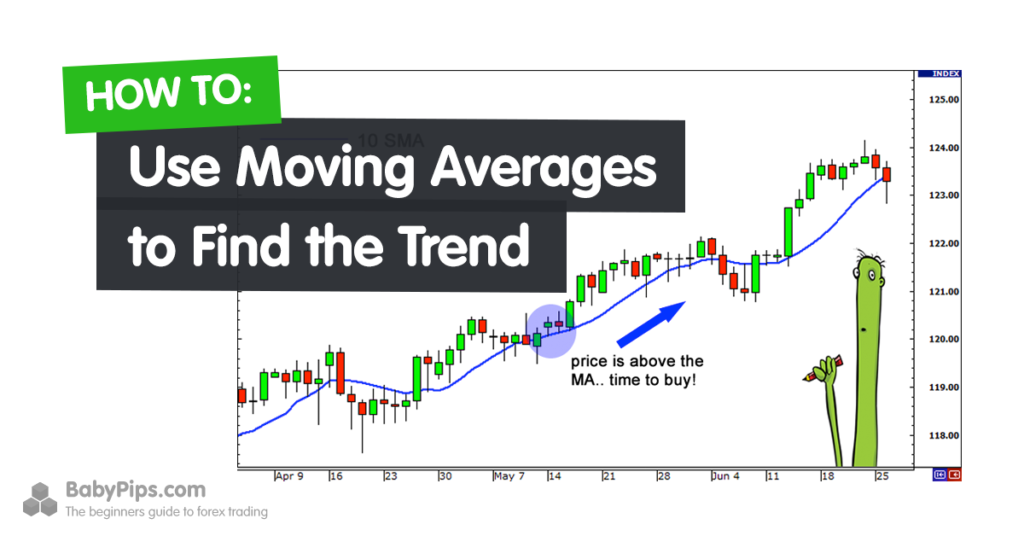
Identifying Trends with Moving Averages
Moving averages are primarily used to determine the direction of the market. Traders often look for two types of trends:
- Trend-following: In this strategy, traders use moving averages to confirm that a trend is established and continue trading in the direction of that trend.
- Mean-reversion: In this strategy, traders believe that prices will revert to the mean or average after a deviation. Moving averages help identify overbought or oversold conditions where reversals are likely to happen.
Crossover Strategy: A Powerful Trading Tool
The most common use of moving averages in trading is the crossover strategy. This involves using two moving averages—one short-term and one long-term—and watching for the point where the short-term moving average crosses above or below the long-term moving average. This crossover can indicate a potential buy or sell signal:
- Golden Cross: A bullish signal occurs when the short-term moving average crosses above the long-term moving average.
- Death Cross: A bearish signal happens when the short-term moving average crosses below the long-term moving average.
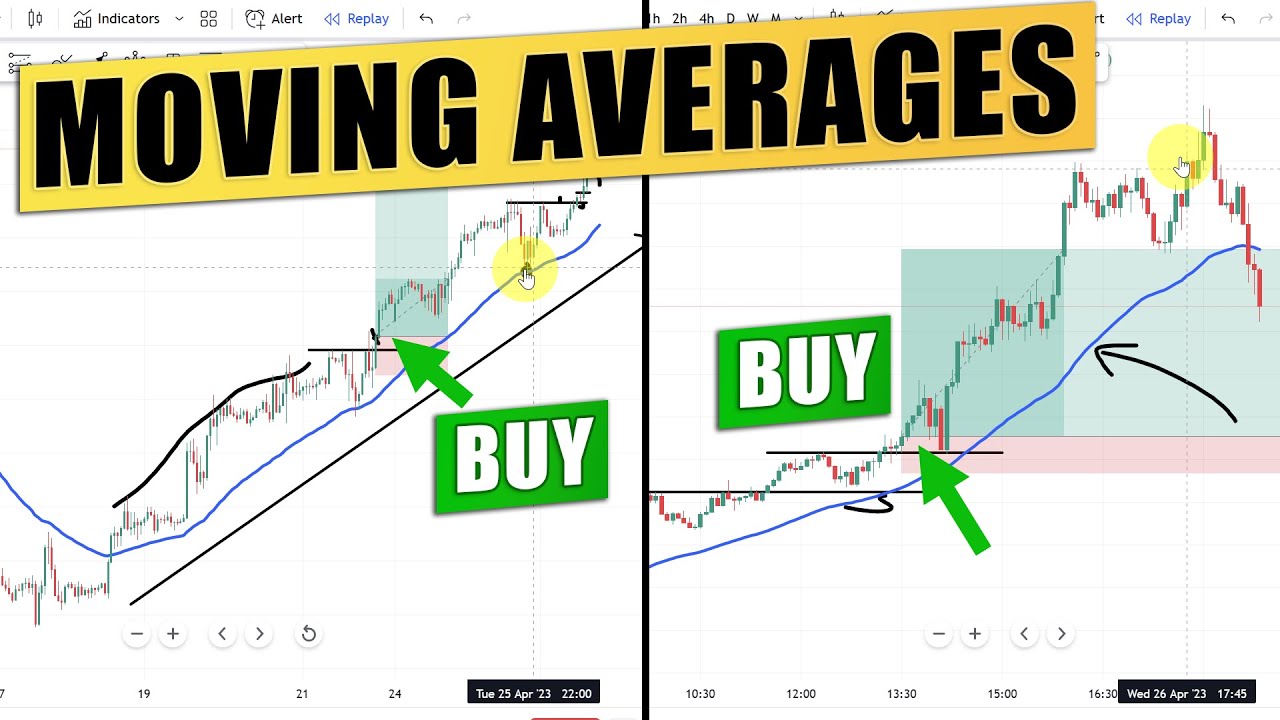
Refining Entry and Exit Points
Moving averages can be used to refine entry and exit points for trades. When a price crosses above a moving average, it can be considered a buy signal, while a price crossing below the moving average can signal a sell opportunity. Traders can also use the distance between the price and the moving average to gauge momentum.
Example Strategy
- Buy Signal: When the price is above both the 50-period and 200-period moving averages, and the 50-period crosses above the 200-period moving average, this signals a long position.
- Sell Signal: When the price is below both the 50-period and 200-period moving averages, and the 50-period crosses below the 200-period moving average, this signals a short position.
Smoothing Market Noise
Market noise—caused by random price fluctuations—can make it difficult to distinguish between real trends and short-term anomalies. By using moving averages, traders can filter out this noise and focus on the underlying trend. A longer period moving average, like the 200-day SMA, tends to be smoother and more reliable for detecting long-term trends.
The Most Effective Moving Average Strategies
Moving Average Crossover
As discussed, the moving average crossover strategy is among the most well-known and widely used. By observing when one moving average crosses over another, traders can get early signals of a potential trend change.
Moving Averages as Trend Filters
Traders can also use moving averages to filter trades. For instance, they might only take trades in the direction of the trend as confirmed by the moving average. If the price is above a moving average, traders may only look for buy signals, and if the price is below a moving average, they may only consider short positions.
Example: 200-Day Moving Average Trend Filter
If the price is above the 200-day moving average, only long trades are considered. Conversely, if the price is below the 200-day moving average, only short trades are considered.
Moving Average Envelope
A moving average envelope is created by plotting two lines above and below a moving average, typically by a fixed percentage. The envelope acts as a channel, with the price expected to bounce between the upper and lower bands. If the price breaks above or below these bands, it can signal a potential trend reversal.
Combining Moving Averages with Other Indicators
Moving averages work well when combined with other technical indicators. For example:
- MACD (Moving Average Convergence Divergence): MACD is derived from two EMAs and helps traders identify changes in momentum and potential reversals.
- Bollinger Bands: These bands use a simple moving average in the center with upper and lower bands that represent standard deviations of the price.
Timeframe Considerations for Moving Averages
The effectiveness of a moving average strategy is also influenced by the timeframes used. Shorter moving averages like the 10-period or 20-period may be better for quick, short-term trades, while longer moving averages such as the 50-period or 200-period moving averages are better for long-term trend-following strategies.
Choosing the Right Timeframe
- Short-Term Traders: Shorter MAs (like the 5, 10, or 20-period) work better for day trading and intraday strategies.
- Long-Term Traders: Longer MAs (like the 50 or 200-period) are ideal for identifying and riding long-term trends.
Advanced Moving Average Strategies
Multi-Moving Average Strategies
Using multiple moving averages of different periods can create more sophisticated strategies. For instance, a trader might use a combination of a short-term (e.g., 10-period) and a long-term (e.g., 200-period) moving average to filter out noise while still capturing major trend shifts.
Moving Average Ribbon
A moving average ribbon consists of multiple moving averages plotted on a chart. It helps visualize the strength and direction of a trend. A ribbon with several moving averages pointing in the same direction is a sign of a strong trend.
The Adaptive Moving Average (AMA) Strategy
The Adaptive Moving Average is dynamic in nature. It adjusts its sensitivity based on market volatility, offering a smoother performance in quiet markets and more responsiveness when volatility rises. This is a highly useful tool for adjusting to changing market conditions.
Backtesting Moving Average Strategies
Backtesting involves running a trading strategy through historical data to evaluate its effectiveness. Moving averages, due to their simplicity, are often among the first indicators tested during backtesting exercises. Traders can test various combinations of time periods, types of moving averages, and crossovers to determine the optimal strategy for specific market conditions.
Benefits of Backtesting Moving Average Strategies
- Optimizes Strategy Parameters: By testing different parameters like the length of the moving averages, traders can fine-tune their strategies.
- Evaluates Performance: Backtesting helps evaluate the performance of a strategy before risking real capital, giving traders confidence in their approach.
- Identifies Key Market Conditions: By analyzing backtest results, traders can identify the market conditions under which their moving average strategy works best.
Conclusion
Moving averages remain one of the most versatile and essential tools in technical analysis. Whether you’re using them for trend identification, entry and exit points, or smoothing market noise, moving averages provide valuable insights for traders across all timeframes. By understanding their various types and applications, and testing them through backtesting, traders can refine their strategies to enhance market timing and improve profitability.
Moving averages are not only a historical tool but remain essential in today’s fast-paced, high-frequency markets. By leveraging advanced strategies like crossovers, envelopes, and adaptive moving averages, traders can stay ahead of market trends and position themselves for long-term success.