 by
by Explore the world of moving averages in forex and cryptocurrency trading. Learn about simple and exponential moving averages, their formulas, and how they can enhance your trading strategies.
Introduction
If you’ve ever dipped your toes into the world of trading, you’ve probably come across the term “moving average.” But what exactly does it mean? In simple terms, a moving average is a statistical calculation used to analyze data points by creating averages of different subsets of the full data set. In the realm of trading, moving averages help smooth out price data to identify trends over a specific period.
In this article, we’ll delve into the intricacies of moving averages, focusing on their application in forex and cryptocurrency markets. We’ll cover:
- What is a Moving Average in Forex?
- Moving Average Formula
- What is a Moving Average Example?
- Moving Average Indicator
- What is Moving Average in Crypto?
- Exponential Moving Average
- Exponential Moving Average Formula
- Simple Moving Average
- What is the Moving Average in Simple Terms?
- What is a Good Moving Average?
- What Does Moving Average 5 Mean?
- What Does the 20-Day Moving Average Tell You?
By the end of this guide, you’ll have a solid understanding of moving averages and how they can be utilized to enhance your trading strategies.
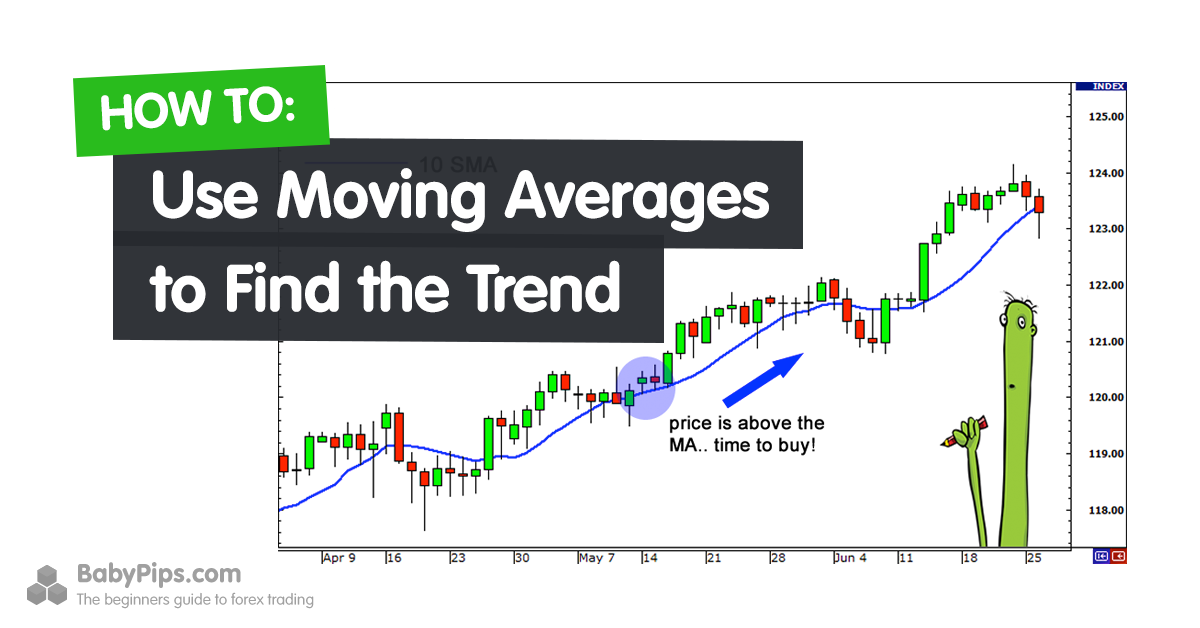
What is a Moving Average in Forex?
In the forex market, a moving average is a technical indicator that smooths out price data to help traders identify trends over a specific period. By averaging past prices, it filters out the “noise” from random price fluctuations, making it easier to spot the underlying trend.
Key Points:
- Purpose: To identify the direction of the trend and potential support or resistance levels.
- Application: Used to confirm trends, generate buy or sell signals, and set stop-loss levels.
Moving Average Formula
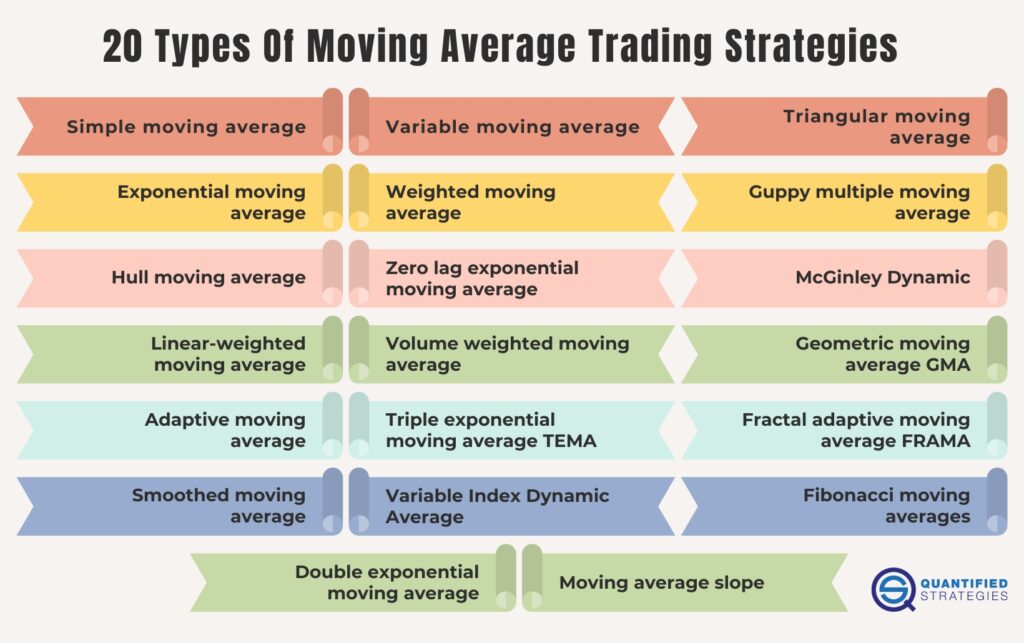
The formula for calculating a moving average depends on the type of moving average being used. The two most common types are:
- Simple Moving Average (SMA):
- Formula: SMA = (P₁ + P₂ + … + Pₙ) / n
- Where:
- P₁, P₂, …, Pₙ = Prices over the specified period
- n = Number of periods
- Exponential Moving Average (EMA):
- Formula: EMA = (Pₙ × (2 / (n + 1))) + (EMAₙ₋₁ × (1 – (2 / (n + 1))))
- Where:
- Pₙ = Most recent price
- n = Number of periods
- EMAₙ₋₁ = Previous EMA value
Note: The EMA gives more weight to recent prices, making it more responsive to new information compared to the SMA.
What is a Moving Average Example?
Let’s consider a simple example to illustrate how a moving average works.
Example:
Imagine you’re analyzing the closing prices of a currency pair over the past five days:
- Day 1: 1.2000
- Day 2: 1.2050
- Day 3: 1.2100
- Day 4: 1.2150
- Day 5: 1.2200
Simple Moving Average (SMA):
SMA = (1.2000 + 1.2050 + 1.2100 + 1.2150 + 1.2200) / 5 = 1.2100
Exponential Moving Average (EMA):
To calculate the EMA, you’d need the previous EMA value and the smoothing factor. For simplicity, let’s assume the previous EMA was 1.2050 and the smoothing factor for a 5-day EMA is 0.3333.
EMA = (1.2200 × 0.3333) + (1.2050 × 0.6667) = 1.2133
As you can see, the EMA is slightly higher than the SMA, reflecting its responsiveness to recent price changes.
Moving Average Indicator
The moving average indicator is a tool used by traders to identify the direction of the trend and potential support or resistance levels. It’s commonly used in conjunction with other indicators to confirm trading signals.
Types of Moving Averages:
- Simple Moving Average (SMA):
- Description: Calculates the average of prices over a specified period.
- Use: Best for identifying long-term trends.
- Exponential Moving Average (EMA):
- Description: Gives more weight to recent prices, making it more responsive to new information.
- Use: Ideal for short-term trading strategies.
How to Use:
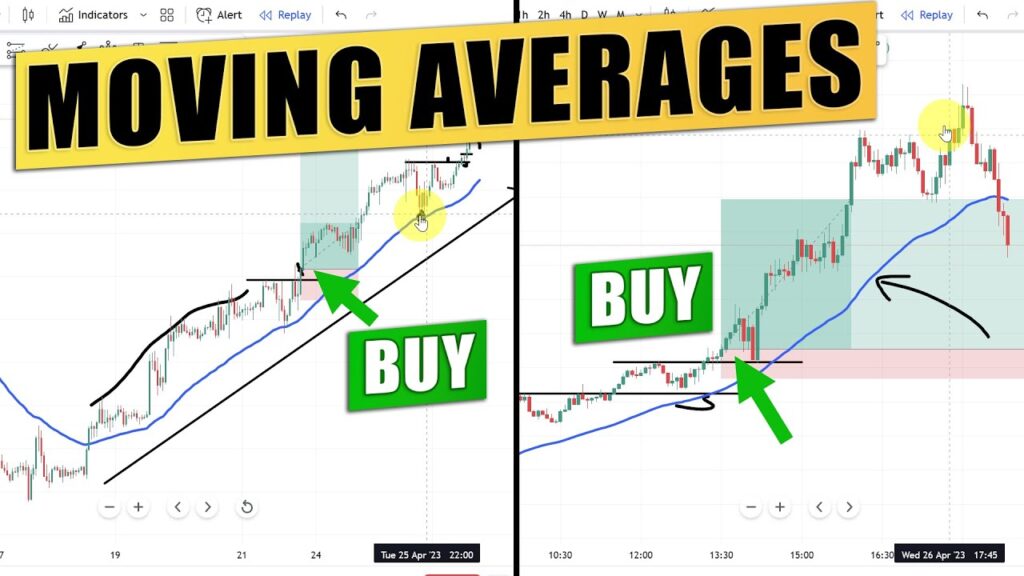
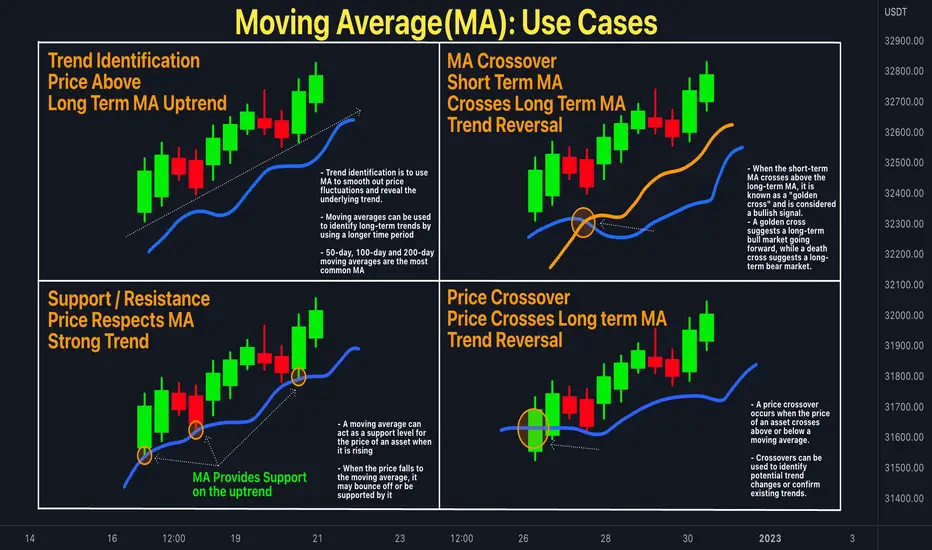
- Trend Identification: When the price is above the moving average, it indicates an uptrend; below indicates a downtrend.
- Support and Resistance: Moving averages can act as dynamic support or resistance levels.
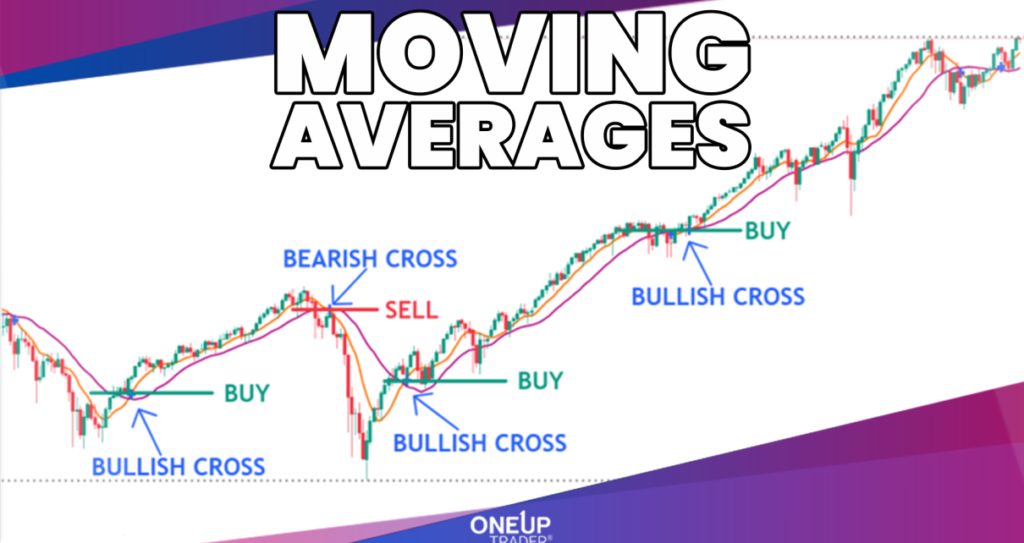
- Signal Generation: Crossovers between different moving averages can signal potential buy or sell opportunities.
What is Moving Average in Crypto?
In the fast-paced world of cryptocurrency trading, staying ahead of market trends is crucial. One tool that traders often rely on is the moving average. But what exactly is a moving average, and how does it apply to crypto? Let’s dive in.
Introduction to Moving Averages
Understanding the Basics
A moving average is a statistical calculation used to analyze data points by creating averages of different subsets of the full data set. In the context of cryptocurrency, it involves calculating the average price of a digital asset over a specific period. This helps smooth out price fluctuations and provides a clearer view of the asset’s trend.
Why Moving Averages Matter in Crypto
Cryptocurrency markets are known for their volatility. Moving averages help traders filter out the “noise” from random price fluctuations, allowing them to identify underlying trends more effectively. By observing these trends, traders can make more informed decisions.
Types of Moving Averages
Simple Moving Average (SMA)
Definition and Calculation
The Simple Moving Average is calculated by adding the closing prices of a cryptocurrency over a set number of periods and then dividing by that number. For example, a 10-day SMA adds the closing prices of the last 10 days and divides by 10.
Pros and Cons
While SMAs are straightforward and easy to calculate, they can be slow to respond to recent price changes, making them less effective in highly volatile markets.
Exponential Moving Average (EMA)
Definition and Calculation
The Exponential Moving Average gives more weight to recent prices, making it more responsive to new information. It’s calculated using a formula that applies a smoothing factor to the previous EMA and the current price.
Pros and Cons
EMAs react more quickly to price changes, which can be advantageous in fast-moving markets. However, they can also be more susceptible to false signals due to their sensitivity.
Weighted Moving Average (WMA)
Definition and Calculation
The Weighted Moving Average assigns different weights to each price point within the period, with more recent prices typically receiving higher weights. This method allows traders to emphasize certain data points over others.
Pros and Cons
WMAs offer flexibility in analysis but can be complex to calculate and may require more data to determine appropriate weights.
How Moving Averages Are Used in Crypto Trading
Identifying Trends
Traders use moving averages to determine the direction of a market trend. If the price is above the moving average, it may indicate an uptrend, while a price below the moving average could suggest a downtrend.
Support and Resistance Levels
Moving averages can act as dynamic support and resistance levels. For instance, during an uptrend, the price may retrace to the moving average before continuing upward, using it as support.
Trading Signals and Strategies
Crossovers between different moving averages can signal potential buy or sell opportunities. For example, when a short-term moving average crosses above a long-term moving average, it might indicate a buying opportunity.
Limitations of Moving Averages in Crypto
Lagging Indicator
Since moving averages are based on past prices, they are inherently lagging indicators. This means they may not predict future price movements accurately, especially in rapidly changing markets.
Sensitivity to Market Volatility
In highly volatile markets like crypto, moving averages can produce false signals. A sudden price spike or drop can cause the moving average to react, potentially leading to misleading conclusions.
Conclusion
Moving averages are valuable tools in cryptocurrency trading, helping traders identify trends and make informed decisions. However, it’s essential to understand their limitations and use them in conjunction with other indicators and analysis methods to navigate the complexities of the crypto market effectively.
FAQs
- What is the difference between SMA and EMA?The Simple Moving Average (SMA) gives equal weight to all prices in the period, while the Exponential Moving Average (EMA) gives more weight to recent prices, making it more responsive to new information.
- Can moving averages predict future crypto prices?No, moving averages are lagging indicators based on past prices and cannot predict future price movements with certainty.
- How do traders use moving averages to identify trends?Traders observe the position of the price relative to the moving average. If the price is above the moving average, it may indicate an uptrend; if below, a downtrend.
- Are moving averages effective in volatile markets?While moving averages can help identify trends, their effectiveness can be limited in highly volatile markets like crypto, as they may produce false signals.
- What is a moving average crossover?A moving average crossover occurs when a short-term moving average crosses above or below a long-term moving average, signaling potential buy or sell opportunities.

Exponential Moving Average: The Secret Sauce Behind Smarter Trading Decisions
Discover how the Exponential Moving Average (EMA) can enhance your trading strategy by providing timely insights and smoothing out market noise.
Introduction
If you’ve ever dipped your toes into the world of trading, you’ve probably come across the term “Exponential Moving Average” or EMA. Sounds fancy, right? But don’t let the jargon fool you—it’s a straightforward tool that can make a world of difference in your trading game. So, what’s all the fuss about? Let’s dive in and uncover how the EMA can be your secret weapon in navigating the ups and downs of the market.
What Is an Exponential Moving Average?
At its core, an Exponential Moving Average is a type of moving average that gives more weight to recent prices, making it more sensitive to new information. Unlike the simple moving average (SMA), which treats all data points equally, the EMA reacts more swiftly to price changes. This responsiveness can be a game-changer when you’re trying to catch trends early or avoid getting caught in market noise.
How Does It Work?
Imagine you’re tracking the price of a stock over the past 10 days. The EMA will assign more significance to the most recent days, allowing it to reflect current market conditions more accurately. This means that if there’s a sudden spike or dip in price, the EMA will pick up on it faster than the SMA would.
Why Should Traders Care About EMA?
Great question! Here’s why the EMA is a favorite among traders:
- Trend Identification: By smoothing out price data, the EMA helps you spot trends more easily.
- Signal Generation: Crossovers between the EMA and the price chart can signal potential buy or sell opportunities.
- Lag Reduction: Its responsiveness means less lag compared to other moving averages, giving you a timely edge.
Calculating the Exponential Moving Average
Alright, let’s get a bit technical. To calculate the EMA, you’ll need:
- Choose a Time Period: Decide how many periods (days, hours, etc.) you want to consider.
- Calculate the Multiplier: Use the formula:Multiplier = 2 / (Time Period + 1)
- Compute the EMA: Apply the formula:EMA = (Current Price – Previous EMA) × Multiplier + Previous EMA
Don’t worry if this sounds a bit complex. Many trading platforms have built-in functions to calculate the EMA for you.
EMA vs. SMA: What’s the Difference?
You might be wondering, “Why not just use the Simple Moving Average?” Well, here’s the scoop:
- Sensitivity: The EMA reacts quicker to price changes, while the SMA is more laid-back.
- Lag: Due to its weighting, the EMA has less lag, making it more timely.
- Use Cases: Traders often prefer the EMA for short-term trading, whereas the SMA might be used for longer-term analysis.
Practical Applications of EMA in Trading
So, how can you put the EMA to work? Here are some practical ways traders use it:
1. Identifying Trends
When the price is above the EMA, it suggests an uptrend. Conversely, if it’s below, a downtrend might be in play.
2. Spotting Crossovers
A bullish crossover happens when the price moves above the EMA, signaling a potential buy. A bearish crossover occurs when the price drops below the EMA, indicating a possible sell.
3. Setting Stop-Loss Levels
Traders often use the EMA as a dynamic stop-loss level, adjusting it as the market moves.
Common Pitfalls to Avoid
While the EMA is a powerful tool, it’s not foolproof. Here are some common mistakes to watch out for:
- Over-Reliance: Don’t base all your decisions solely on the EMA. Combine it with other indicators for a well-rounded strategy.
- Ignoring Market Conditions: The EMA might not perform well in choppy or sideways markets.
- Using Too Short a Time Frame: An EMA with a very short time period can be overly sensitive, leading to false signals.
FAQs About Exponential Moving Averages
Q1: Can I use the EMA for all types of trading?
Absolutely! Whether you’re into stocks, forex, or commodities, the EMA can be a valuable tool.
Q2: How do I choose the right time period for the EMA?
It depends on your trading style. Shorter periods (like 9 or 12) are great for day trading, while longer periods (like 50 or 200) suit swing or position trading.
Q3: Is the EMA better than other indicators?
It’s not about being better; it’s about being suitable. The EMA offers timely insights, but it’s best used alongside other indicators for confirmation.
Q4: How can I practice using the EMA without real money?
Many trading platforms offer demo accounts where you can practice using the EMA in real-time market conditions without any financial risk.
Conclusion
In the fast-paced world of trading, having tools that can keep up is crucial. The Exponential Moving Average offers a dynamic way to analyze market trends and make informed decisions. By understanding its mechanics and applications, you can enhance your trading strategy and navigate the markets with greater confidence. Remember, while the EMA is a powerful tool, it’s most effective when used as part of a comprehensive trading plan. So, why not give it a try and see how it can work for you?
Understanding the Exponential Moving Average (EMA) Formula
The Exponential Moving Average (EMA) is a pivotal tool in technical analysis, widely utilized to smooth time-series data and identify trends in various financial markets. Unlike the Simple Moving Average (SMA), which assigns equal weight to all data points, the EMA gives greater significance to more recent prices, making it more responsive to recent market movements.
Formula for Calculating the Exponential Moving Average
The EMA is calculated using the following formula:
EMA = (Closing Price × Multiplier) + (Previous EMA × (1 – Multiplier))
Where:
- Closing Price: The price of the asset at the end of the current period.
- Multiplier: A smoothing constant that determines the weight of the most recent price. It is calculated as:
- Multiplier = 2 ÷ (Time Period + 1)
- Previous EMA: The EMA value from the previous period.
Step-by-Step Calculation
- Determine the Time Period (N): Select the number of periods (e.g., 10, 20, 50) over which you want to calculate the EMA.
- Calculate the Multiplier: Use the formula above to compute the multiplier. For instance, for a 20-day EMA:
- Multiplier = 2 ÷ (20 + 1) = 0.0952
- Calculate the Initial EMA: The initial EMA is typically the Simple Moving Average (SMA) of the first N periods.
- Compute the EMA for Subsequent Periods: Apply the EMA formula iteratively for each subsequent period, using the previous EMA value in the calculation.
Example Calculation
Consider a 10-day EMA with the following closing prices over 10 days:
| Day | Closing Price |
|---|---|
| 1 | 20 |
| 2 | 22 |
| 3 | 21 |
| 4 | 23 |
| 5 | 24 |
| 6 | 25 |
| 7 | 26 |
| 8 | 27 |
| 9 | 28 |
| 10 | 29 |
- Calculate the Multiplier:
- Multiplier = 2 ÷ (10 + 1) = 0.1818
- Compute the Initial EMA:
- Initial EMA = (20 + 22 + 21 + 23 + 24 + 25 + 26 + 27 + 28 + 29) ÷ 10 = 24.5
- Calculate the EMA for Day 11:
- EMA = (29 × 0.1818) + (24.5 × (1 – 0.1818)) = 5.27 + 20.05 = 25.32
- Continue for Subsequent Days:
- Repeat the EMA formula for each subsequent day, using the previous day’s EMA in the calculation.
Advantages of Using the EMA
- Responsiveness to Recent Prices: The EMA reacts more swiftly to recent price changes compared to the SMA, making it valuable for traders seeking to identify trends promptly.
- Reduced Lag: By assigning greater weight to recent prices, the EMA reduces the lag associated with moving averages, allowing for more timely decision-making.
- Versatility: The EMA can be applied across various time frames and asset classes, including stocks, commodities, and forex markets.
Common Applications of the EMA
- Trend Identification: Traders use the EMA to determine the direction of the market. A rising EMA suggests an uptrend, while a declining EMA indicates a downtrend.
- Signal Generation: Crossovers between different EMAs (e.g., a short-term EMA crossing above a long-term EMA) can signal potential buy or sell opportunities.
- Support and Resistance Levels: The EMA can act as dynamic support or resistance, with prices often bouncing off the EMA line during trends.
Considerations When Using the EMA
- Parameter Selection: The choice of time period (N) significantly impacts the sensitivity of the EMA. Shorter periods make the EMA more sensitive to price changes, while longer periods smooth out fluctuations.
- Market Conditions: The effectiveness of the EMA can vary depending on market volatility and the asset being analyzed. It’s essential to consider the broader market context when interpreting EMA signals.
- Complementary Indicators: While the EMA is a powerful tool, it is often used in conjunction with other technical indicators and analysis methods to confirm signals and enhance decision-making.
In conclusion, the Exponential Moving Average is a fundamental tool in technical analysis, offering a nuanced approach to trend analysis by emphasizing recent price data. Its adaptability and responsiveness make it a valuable asset for traders and analysts aiming to navigate the complexities of financial markets effectively.
Understanding the Simple Moving Average (SMA): A Comprehensive Guide
The Simple Moving Average (SMA) is a fundamental concept in technical analysis, widely utilized by traders and investors to assess market trends and make informed decisions. By calculating the average of a security’s price over a specific period, the SMA offers a smoothed representation of price movements, effectively filtering out short-term fluctuations.
What is a Simple Moving Average?
An SMA is an arithmetic calculation that determines the average of a security’s price over a designated number of periods. This method is particularly effective in identifying the direction of the trend, as it smooths out daily price volatility. The formula for calculating the SMA is:
SMA=P1+P2+⋯+Pnn\text{SMA} = \frac{P_1 + P_2 + \cdots + P_n}{n}SMA=nP1+P2+⋯+Pn
Where:
- P1,P2,…,PnP_1, P_2, \dots, P_nP1,P2,…,Pn are the prices of the security over the nnn periods.
- nnn is the number of periods.
For example, to calculate a 10-day SMA, sum the closing prices of the last 10 days and divide by 10.
Types of Moving Averages
While the SMA is the most straightforward moving average, there are other types that offer different insights:
- Exponential Moving Average (EMA): Gives more weight to recent prices, making it more responsive to new information.
- Weighted Moving Average (WMA): Assigns varying weights to different prices, allowing for a more customized analysis.
Each type has its advantages and is chosen based on the specific requirements of the analysis.
Calculating the Simple Moving Average
To compute the SMA, follow these steps:
- Select the Time Period: Decide on the number of periods (days, weeks, months) for the moving average.
- Gather the Data: Collect the closing prices for the chosen time frame.
- Sum the Prices: Add together all the closing prices.
- Divide by the Number of Periods: Divide the total sum by the number of periods to obtain the average.
This calculation provides a single value that represents the average price over the specified period.
Applications of the Simple Moving Average
The SMA is employed in various ways within technical analysis:
- Trend Identification: By observing the direction of the SMA, traders can determine whether a market is in an uptrend or downtrend.
- Support and Resistance Levels: The SMA can act as a dynamic support or resistance level, where prices may reverse direction upon reaching the moving average.
- Signal Generation: Crossovers between different SMAs (e.g., a short-term SMA crossing above a long-term SMA) can signal potential buy or sell opportunities.
Advantages of Using the Simple Moving Average
The SMA offers several benefits:
- Simplicity: Its straightforward calculation makes it easy to understand and implement.
- Trend Clarity: It effectively highlights the prevailing market trend by smoothing out price data.
- Versatility: Applicable across various time frames and asset classes, making it a versatile tool for traders.
Limitations of the Simple Moving Average
Despite its advantages, the SMA has certain limitations:
- Lagging Indicator: As it is based on historical data, the SMA may not promptly reflect sudden market changes.
- Sensitivity to Outliers: Extreme price movements can disproportionately affect the SMA, potentially distorting the analysis.
Enhancing Analysis with Multiple Moving Averages
To address the limitations of a single SMA, traders often use multiple moving averages with varying periods:
- Short-Term vs. Long-Term SMAs: Comparing a short-term SMA (e.g., 10-day) with a long-term SMA (e.g., 50-day) can provide insights into the strength and direction of a trend.
- Moving Average Crossovers: Observing when a short-term SMA crosses above or below a long-term SMA can signal potential entry or exit points.
These strategies offer a more nuanced understanding of market dynamics.
Practical Example: Implementing the 200-Day Simple Moving Average
A widely used strategy involves the 200-day SMA, which represents the average closing price over the past 200 trading days. This long-term moving average is often used to identify the overall market trend:
- Bullish Signal: When the price is above the 200-day SMA, it indicates a long-term uptrend.
- Bearish Signal: When the price is below the 200-day SMA, it suggests a long-term downtrend.
Traders may use this information to make strategic decisions, such as entering long positions during bullish phases and considering caution or short positions during bearish phases.
Conclusion
The Simple Moving Average is a foundational tool in technical analysis, offering valuable insights into market trends and price behavior. By understanding its calculation, applications, and limitations, traders and investors can effectively incorporate the SMA into their analytical toolkit, enhancing their ability to make informed decisions in the dynamic world of financial markets.
Understanding Moving Averages: A Comprehensive Guide
In the realm of financial analysis, moving averages are fundamental tools that assist investors and traders in identifying trends, smoothing out price data, and making informed decisions. This article delves into the concept of moving averages, explores what constitutes a “good” moving average, and examines the significance of specific time frames such as the 5-day and 20-day moving averages.
What is a Moving Average?
A moving average (MA) is a statistical calculation used to analyze data points by creating a series of averages of different subsets of the full data set. In financial markets, moving averages are primarily used to smooth out short-term fluctuations and highlight longer-term trends or cycles. They are essential in technical analysis for identifying support and resistance levels, as well as potential entry and exit points.
Types of Moving Averages
There are several types of moving averages, each serving distinct purposes:
- Simple Moving Average (SMA): This is the most straightforward type, calculated by adding the closing prices of a security over a specific period and then dividing by the number of periods. For example, a 20-day SMA is the average of the closing prices over the past 20 days.
- Exponential Moving Average (EMA): Unlike the SMA, the EMA gives more weight to recent prices, making it more responsive to new information. This characteristic allows traders to identify trends more promptly.
- Weighted Moving Average (WMA): This type assigns different weights to each data point, allowing for more flexibility in analysis.
What Constitutes a Good Moving Average?
Determining a “good” moving average depends on the specific trading strategy and the asset being analyzed. Shorter-term moving averages, such as the 10-day or 20-day, are more sensitive to recent price changes and are often used for short-term trading strategies. Longer-term moving averages, like the 50-day or 200-day, are less sensitive and are typically used to identify long-term trends. The choice of moving average should align with the trader’s objectives and the market conditions.
What Does a 5-Day Moving Average Mean?
A 5-day moving average calculates the average closing price of a security over the past five days. This short-term moving average is highly sensitive to recent price movements and is often used by traders to identify short-term trends or potential entry and exit points. However, due to its sensitivity, it can also produce false signals during periods of high volatility.
What Does the 20-Day Moving Average Tell You?
The 20-day moving average is a widely used indicator that provides a balance between short-term and long-term trends. It smooths out daily price fluctuations and helps traders and investors identify the prevailing trend direction. When the price is above the 20-day moving average, it may indicate an uptrend, while a price below the 20-day moving average could suggest a downtrend. Additionally, the 20-day moving average can act as a dynamic support or resistance level, influencing trading decisions.
Practical Applications of Moving Averages
Moving averages are versatile tools with various applications in trading and investment strategies:
- Trend Identification: By observing the direction of the moving average, traders can determine the prevailing market trend. An upward-sloping moving average suggests an uptrend, while a downward-sloping moving average indicates a downtrend.
- Support and Resistance Levels: Moving averages can act as dynamic support or resistance levels. For instance, during an uptrend, the price may find support at the moving average, while in a downtrend, it may encounter resistance.
- Crossover Strategies: Traders often use crossovers between different moving averages to generate trading signals. For example, when a short-term moving average crosses above a long-term moving average, it may signal a buying opportunity, and vice versa for a selling opportunity.
Limitations of Moving Averages
While moving averages are powerful tools, they have limitations:
- Lagging Indicator: Since moving averages are based on past prices, they are inherently lagging indicators and may not predict future price movements accurately.
- False Signals: During periods of high volatility or sideways markets, moving averages can produce false signals, leading to potential losses.
- Parameter Sensitivity: The effectiveness of a moving average depends on the chosen time period. A moving average that is too short may be overly sensitive, while one that is too long may be too slow to react to recent price changes.
Conclusion
In summary, moving averages are essential tools in technical analysis, aiding in trend identification, smoothing out price data, and assisting in making informed trading decisions. Understanding the different types of moving averages and their applications can enhance trading strategies and improve market analysis. However, it is crucial to use moving averages in conjunction with other indicators and market analysis techniques to mitigate their limitations and increase the probability of successful trades.