 by
by The Moving Average Convergence Divergence (MACD) is a widely utilized momentum oscillator in technical analysis, designed to reveal changes in the strength, direction, momentum, and duration of a trend in a security’s price. Developed by Gerald Appel in the late 1970s, the MACD assists traders in identifying potential buying and selling opportunities by analyzing the convergence and divergence of moving averages.
Components of the MACD
The MACD consists of three primary components:
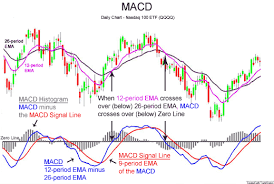
- MACD Line: Calculated by subtracting the 26-period Exponential Moving Average (EMA) from the 12-period EMA. This line illustrates the relationship between short-term and long-term price movements.
- Signal Line: A 9-period EMA of the MACD line, serving as a trigger for potential buy or sell signals. When the MACD line crosses above the signal line, it may indicate a bullish signal; conversely, crossing below may suggest a bearish signal.
- MACD Histogram: A graphical representation of the difference between the MACD line and the signal line. The histogram aids in visualizing the momentum of the price movement; increasing histogram bars suggest strengthening momentum, while decreasing bars indicate weakening momentum.
Calculating the MACD
To compute the MACD line:
MACD Line = 12-period EMA – 26-period EMA
The signal line is then derived as:
Signal Line = 9-period EMA of the MACD Line
The MACD histogram is determined by:
MACD Histogram = MACD Line – Signal Line
These calculations enable traders to assess the momentum and potential direction of a security’s price movement.
Interpreting the MACD
The MACD provides several signals that traders monitor:
- Signal Line Crossovers: When the MACD line crosses above the signal line, it generates a bullish signal, suggesting it may be an opportune time to buy. Conversely, when the MACD line crosses below the signal line, it produces a bearish signal, indicating it might be time to sell.
- Zero Line Crossovers: A crossover of the MACD line above the zero line indicates a shift to bullish momentum, while crossing below the zero line signifies bearish momentum.
- Divergence: Divergence occurs when the price of a security and the MACD move in opposite directions. A bullish divergence happens when the price makes a new low, but the MACD does not, potentially indicating a reversal to an upward trend. A bearish divergence occurs when the price reaches a new high, but the MACD fails to follow, suggesting a possible downward reversal.
Practical Application of the MACD
Traders employ the MACD to identify potential entry and exit points in the market:
- Identifying Trends: The MACD helps in recognizing the direction and strength of a trend. Positive MACD values suggest an uptrend, while negative values indicate a downtrend.
- Timing Entries and Exits: By observing signal line crossovers and divergences, traders can make informed decisions about when to enter or exit a position.
- Confirming Other Indicators: The MACD is often used alongside other technical indicators, such as the Relative Strength Index (RSI), to confirm signals and enhance trading strategies.
Limitations of the MACD
While the MACD is a valuable tool, it has certain limitations:
- Lagging Indicator: As a trend-following indicator, the MACD may lag behind price movements, potentially resulting in delayed signals.
- False Signals: In volatile or sideways markets, the MACD can produce false signals, leading to potential losses if not corroborated with other analysis tools.
Enhancing MACD Analysis
To improve the effectiveness of the MACD in trading decisions:
- Combine with Other Indicators: Utilize the MACD in conjunction with other technical analysis tools, such as moving averages, RSI, or support and resistance levels, to validate signals.
- Adjust Parameters: Depending on the trading timeframe and the specific security, adjusting the standard parameters (12, 26, 9) of the MACD can provide more responsive or smoother signals.
- Consider Market Context: Analyze the broader market context and underlying fundamentals to support technical findings from the MACD.
Conclusion
The Moving Average Convergence Divergence (MACD) is a robust and versatile indicator that assists traders in identifying trends, momentum shifts, and potential reversal points in the market. By understanding its components, calculations, and interpretations, and by acknowledging its limitations, traders can effectively incorporate the MACD into their technical analysis toolkit to make more informed trading decisions.
Mastering the MACD Indicator for Effective Stock Trading
The Moving Average Convergence Divergence (MACD) is a pivotal tool in technical analysis, offering traders insights into market momentum and potential trend reversals. Developed by Gerald Appel in the late 1970s, the MACD has become indispensable for those aiming to make informed trading decisions.
Understanding the MACD Components
The MACD consists of three primary elements:
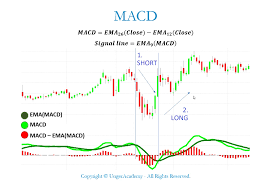
- MACD Line: Calculated by subtracting the 26-period Exponential Moving Average (EMA) from the 12-period EMA, this line gauges the difference between short-term and long-term price movements.
- Signal Line: A 9-period EMA of the MACD line, it serves as a trigger for buy and sell signals.
- Histogram: This represents the difference between the MACD line and the Signal Line, providing a visual depiction of their convergence or divergence.
Interpreting MACD Signals
The MACD offers several signals that traders can utilize:
- Signal Line Crossovers: When the MACD line crosses above the Signal Line, it generates a bullish signal, suggesting it’s an opportune moment to buy. Conversely, when the MACD line crosses below the Signal Line, it indicates a bearish signal, implying it might be time to sell. Investopedia
- Zero Line Crossovers: A move above the zero line by the MACD line signifies positive momentum, while a move below indicates negative momentum. Fidelity
- Divergence: When the price of a stock and the MACD move in opposite directions, it can signal a potential reversal. For instance, if prices are rising but the MACD is falling, it may indicate weakening momentum and a forthcoming downturn. Investopedia
Implementing MACD in Trading Strategies
To harness the full potential of the MACD, consider the following strategies:
- MACD and Signal Line Crossovers: A common approach is to buy when the MACD line crosses above the Signal Line and sell when it crosses below. This method capitalizes on shifts in momentum. Investopedia
- Zero Line Crossovers: Traders might buy when the MACD crosses above the zero line, indicating a shift to positive momentum, and sell when it crosses below, signaling negative momentum. Fidelity
- Divergence Analysis: Identifying divergences between the MACD and price can alert traders to potential trend reversals. For example, if the price reaches a new high but the MACD does not, it may suggest a weakening trend. Investopedia
- Combining MACD with Other Indicators: Enhance the reliability of MACD signals by using it alongside other technical indicators such as the Relative Strength Index (RSI) or moving averages. This multi-faceted approach can provide more robust trading signals. Wikipedia
Best Practices for Using MACD
- Avoiding False Signals: The MACD can sometimes produce false signals, especially in sideways or choppy markets. It’s prudent to confirm MACD signals with additional analysis or indicators. Investopedia
- Adjusting MACD Settings: While the default settings (12, 26, 9) are widely used, adjusting these parameters to fit specific trading styles or timeframes can yield better results.
- Incorporating Longer-Term Moving Averages: Aligning MACD signals with longer-term moving averages, such as the 50-day or 200-day EMA, can provide context. For instance, if the price is above these averages and the MACD signals a buy, it reinforces a bullish trend. Conversely, if the price is below and the MACD signals a sell, it indicates a strong bearish trend.
Conclusion
The MACD is a versatile and powerful indicator that, when used correctly, can significantly enhance trading performance. By understanding its components and signals, and by integrating it into a comprehensive trading strategy, traders can make more informed and effective decisions in the stock market.